13 Jan 2024. Saturday.

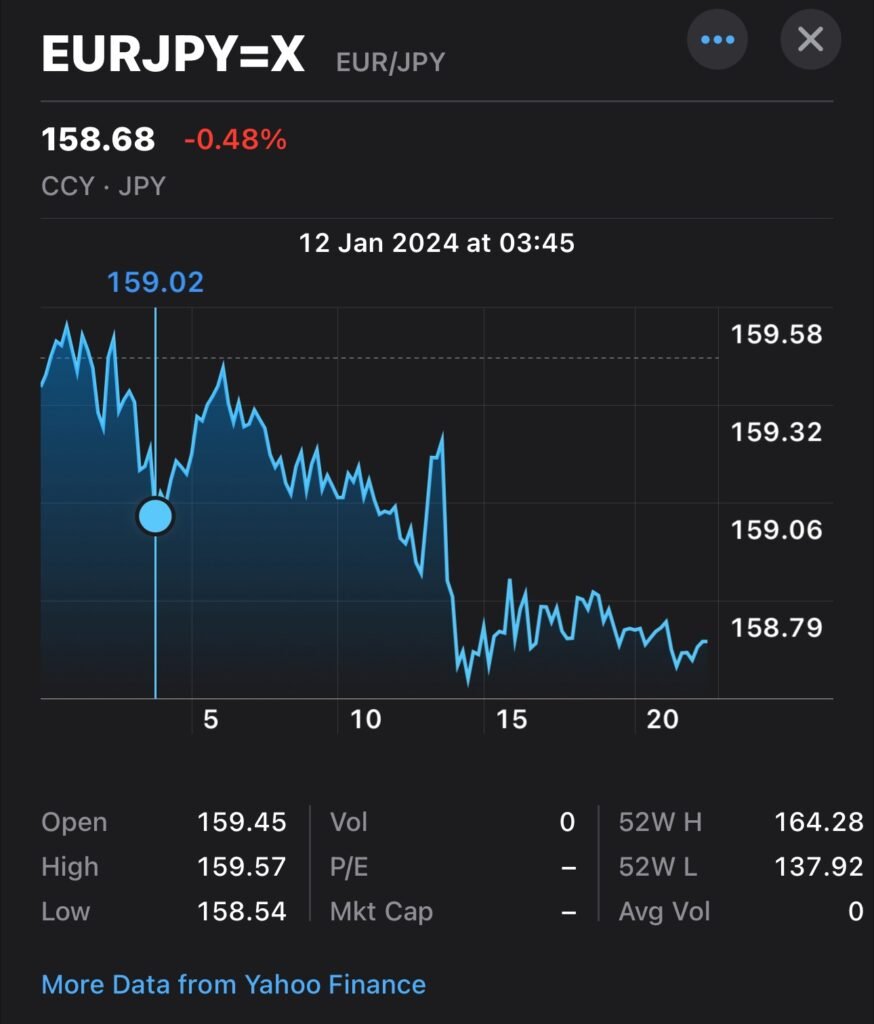
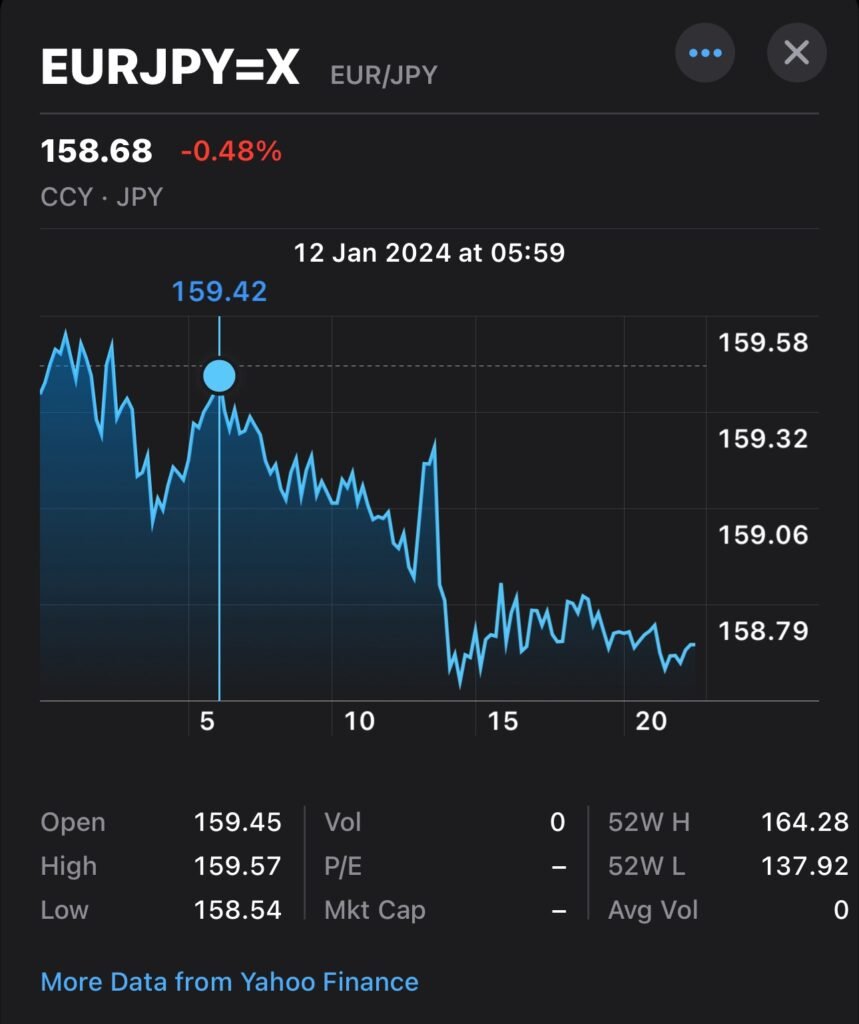
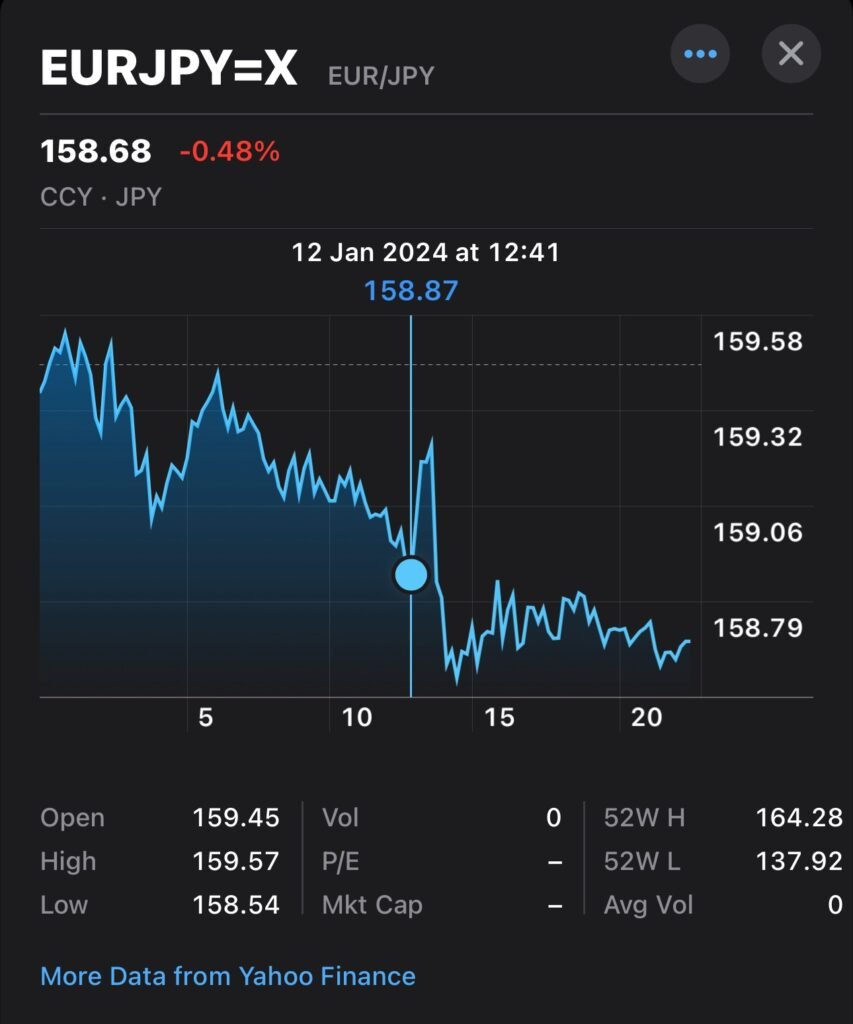
This is the Euro vs Japanese Yen (Eur/Jpy) chart on 12 Jan 2024.
For simplicity, take note that for the Eur/Jpy currency pair, the third decimal point shall be accounted for. This does not apply to other currency pairs.
Observations:
(1) The market opened at 159.45 and closed at 158.68. This figure can be seen on the bottom and top left of the chart respectively.
The figures could also be derived from the vertical axis of the chart.
The horizontal axis signifies time.
(2) The trade went up as high as 159.57 to as low as 158.54. Figures can be seen on the bottom left of the chart.
The difference between the (highest) high and the (lowest) low was 1030.
159570 – 158540 = 1030.
The figures were divided by 1000 to account for the third decimal point and zero was assumed to be the third decimal point as no other information can be construed from the chart.
Hence, there was a downward difference of 1030 pips (-1030 pips).
(3) The market opened at 159.45 and proceeded to climb to the highest high of 159.57 (+120 pips). These figures can be seen on the bottom left of the chart.
It went down to 159.02 (-550 pips) and rebounded (+400 pips).


The market continued down to 158.87 (-550 pips) and rebounded (+350 pips) before continuing further down to the lowest low of 158.54 (-680 pips).


—-
Conclusion:
The observations were to give you meaning to what pips are in real life situations and a sense of the volatility of the Eur/Jpy forex market on Friday, 12 Jan 2024.